The national average cost to upgrade a rental property to EPC C is £7,633. Across the UK's 3.38 million non-compliant properties, that adds up to a total bill of £26 billion.
But averages obscure everything that matters. A landlord in Kensington can absorb the same upgrade cost that would bankrupt a landlord in Powys, because London rents are four times higher. The real story isn't what upgrades cost. It's what they cost relative to what you earn.
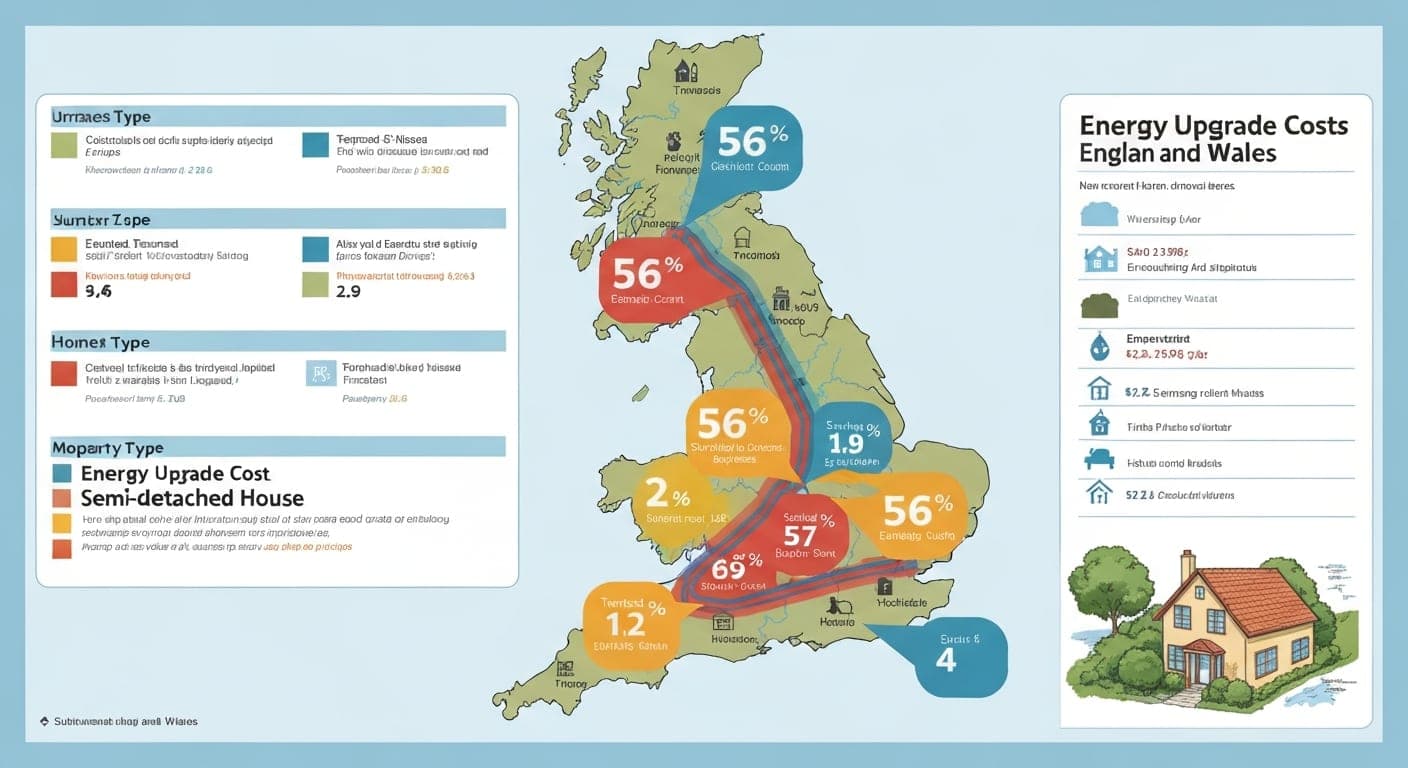
Here's the full regional picture.
The National Picture: £7,633 Average to Reach EPC C
New analysis by Just Landlords (March 2026), covering all non-compliant private rental properties in England and Wales, puts the average upgrade cost to reach EPC C at £7,633 per property. That figure covers the full range of retrofit measures, from a £300 loft insulation top-up to a £15,000 solid wall insulation and heat pump installation.
The 3.38 million non-compliant properties represent roughly 40% of the entire private rental stock. Meeting the 2030 EPC C deadline for all of them would cost the sector more than £26 billion.
That number has been widely quoted. What's received far less attention is how unevenly that £26bn falls.
The Repair-to-Rent Ratio: A Better Way to Measure the Pain
Just Landlords introduced the concept of the repair-to-rent ratio, the average upgrade cost expressed as a percentage of average annual rental income in each area. This is a far more useful metric than raw cost because it captures the actual financial burden on landlords.
A London landlord with a 20% repair-to-rent ratio is spending the equivalent of 10 weeks' rent on upgrades. A rural Welsh landlord with a 148% ratio is spending the equivalent of 18 months' rent.
Worst Repair-to-Rent Ratios: Where Landlords Are Most Squeezed
| Local Authority | Repair-to-Rent Ratio | Avg Upgrade Cost | Avg Annual Rent |
|---|---|---|---|
| Powys | 148% | £10,759 | £7,248 |
| Hartlepool | 138% | , | , |
| Isle of Anglesey | 135% | , | , |
| Gwynedd | 131% | , | , |
| Northumberland | 129% | , | , |
In Powys, rural mid-Wales, the average upgrade cost exceeds the annual rental income. A landlord there would need to redirect every pound of rent for 18 months just to cover compliance costs, before a penny of maintenance, mortgage, or income.
Best Repair-to-Rent Ratios: How London Is Insulated
| Local Authority | Repair-to-Rent Ratio | Notes |
|---|---|---|
| Kensington & Chelsea | 20% | High rents absorb the same upgrade cost |
| Westminster | 22% | |
| Islington | 25% | |
| Hammersmith & Fulham | 25% | |
| Camden | 26% |
London's top boroughs face the same retrofit costs as anywhere else in the country. What's different is that rents of £2,500–£4,000/month make those costs a much smaller proportion of income. A 20% repair-to-rent ratio means a landlord recovers the upgrade cost in under three months of extra margin, if they can raise rents post-upgrade.
EPC Compliance Levels by Region
The repair-to-rent data tells you where costs are most painful. Compliance data tells you how much work is left to do.
Most Compliant Areas
| Local Authority | Properties at EPC C+ |
|---|---|
| Tower Hamlets | 66% |
| West Northamptonshire | 55% |
| Southwark | 53% |
| Bracknell Forest | 51% |
| Islington | 51% |
Urban areas with newer housing stock and higher-density flat conversions tend to perform best. Many purpose-built urban flats already meet EPC C through double glazing and communal heating systems.
Least Compliant Areas
| Local Authority | Non-Compliant Properties |
|---|---|
| Isles of Scilly | 90% |
| Ryedale (North Yorkshire) | 88% |
| Isle of Anglesey | 87% |
| Burnley | 85% |
| Pendle | 85% |
The pattern is consistent: rural, coastal, and northern areas with older housing stock cluster at the bottom. Nine in ten properties in the Isles of Scilly would need upgrades before 2030. Ryedale and Pendle face similarly daunting numbers.
Deep Retrofit Zones
Some areas face a particularly expensive challenge: more than half their non-compliant properties sit in bands E, F, or G, meaning simple measures won't be enough.
| Area | Properties in Band E/F/G |
|---|---|
| Isles of Scilly | 70% |
| Isle of Anglesey | 60% |
| Ryedale | 57% |
| Eden (Cumbria) | 56% |
| Powys | 52% |
Properties in this category typically require solid wall insulation (£2,000–£8,000) and potentially a heat pump, the most expensive and disruptive upgrades. Many are pre-1919 stone or brick construction with no cavity walls to fill.
Why the North–South and Rural–Urban Divide Exists
The regional cost gap isn't random. Four structural factors explain why rural and northern landlords face a significantly harder path to compliance.
Property age. Rural areas contain a disproportionate share of pre-1919 buildings. These properties use solid-wall construction, no cavity to fill with blown mineral fibre. Solid wall insulation (internal or external) costs four to eight times more than cavity wall insulation and involves significant disruption.
Property type. Detached and semi-detached houses have more exposed surfaces than terraced rows or flats. More surface area means more heat loss and a bigger uplift required from insulation measures.
The rent gap. Average annual rents in rural areas run £6,000–£9,000. In prime London they run £36,000–£48,000. The upgrade costs are broadly similar, but what that cost represents as a proportion of income is completely different.
Heat pump suitability. Older rural housing stock is frequently the least suited for heat pump installation, the combination of poor insulation, large floor areas, and older radiator systems means heat pumps underperform. Under the incoming Home Energy Model metrics (from 2027), heat pumps and solar panels will be required for many properties to achieve a C rating, further disadvantaging rural stock.
What This Means for Landlords in Worst-Hit Areas
If your property is in one of the high-ratio areas above, the situation is difficult, but it's not unmanageable. Three steps before you panic.
Check Your Individual Property First
Regional averages can be misleading for individual properties. A pre-1919 terraced house in Burnley might cost £4,000 to upgrade (loft insulation + modern boiler controls + LED lighting). A detached Victorian farmhouse in Powys might genuinely cost £14,000. Your EPC report's recommended measures section shows exactly which interventions apply to your property and what they cost.
Use the EPCGuide property cost estimator for a ballpark figure based on your property type and current EPC band.
Available Grants Can Significantly Reduce the Bill
Two major schemes can cut costs substantially:
- ECO4: For properties below EPC D with tenants on qualifying benefits. Can fund insulation and heating upgrades at no cost to the landlord. Check grant eligibility
- Warm Homes Local Grant: Area-dependent. Greater Manchester landlords in the Good Landlord Charter can access up to £30,000. Other combined authorities are running similar programmes. See if your area is covered
If Costs Genuinely Exceed £10,000, The Cost Cap Exemption
If you can demonstrate that the improvements needed to reach EPC C would cost more than £10,000 per property, you can register a cost cap exemption. This doesn't exempt you from having a valid EPC or from the minimum E standard, but it provides legal protection against enforcement for the C threshold. See the full rules at cost cap exemptions.
How Does This Compare to Your Local Area?
The national and regional data gives you context. For the specifics of your city, local grant schemes, council enforcement priorities, and property-type patterns, we've published detailed local guides:
- London EPC Landlord Guide
- Manchester EPC Landlord Guide
- Birmingham EPC Landlord Guide
- Leeds EPC Landlord Guide
- Newcastle EPC Landlord Guide
- Sheffield EPC Landlord Guide
- Bristol EPC Landlord Guide
If your city isn't listed, the property cost estimator and grant checker tools work for any UK address.
Frequently Asked Questions
What's the average EPC upgrade cost in the UK?
The national average is £7,633 per non-compliant property, based on Just Landlords' March 2026 analysis. This covers the cost of all works needed to reach EPC C. The range is wide: a D-rated property with good insulation may cost only £1,000–£3,000 to push into C, while an E/F-rated rural property requiring solid wall insulation and heating upgrades can cost £12,000–£15,000.
Which UK regions have the highest EPC upgrade costs relative to income?
Rural mid-Wales (Powys, Gwynedd), the Isle of Anglesey, and parts of the north-east (Hartlepool, Northumberland) have the worst repair-to-rent ratios, in some cases upgrade costs exceed one full year's rental income. This is driven by a combination of older property stock, lower rents, and the need for expensive solid wall insulation.
Why are EPC upgrade costs more manageable in London?
The upgrade costs themselves are broadly similar to the rest of the country. What's different is that London's high rental yields, often 2–4 times higher than rural equivalents, mean the same upgrade represents a far smaller share of annual income. A landlord in Kensington & Chelsea has a repair-to-rent ratio of just 20%.
Are there grants available for landlords in high-cost regions?
Yes. The ECO4 scheme (for properties below EPC D with lower-income tenants) can fund insulation and heating upgrades at no landlord cost. The Warm Homes Local Grant covers up to £30,000 in some areas. The Boiler Upgrade Scheme offers up to £7,500 toward a heat pump installation, available to all landlords regardless of tenant income. Availability depends on your local authority and tenant eligibility. Use the grant checker tool to find what applies to your property.
What is a "deep retrofit zone" for EPC purposes?
Areas where more than 50% of non-compliant properties are in bands E, F, or G, meaning they're likely to need solid wall insulation and potentially heat pumps, the most expensive and disruptive upgrade route. Isles of Scilly, Isle of Anglesey, Ryedale, Eden, and Powys are the hardest-hit.
Data: Just Landlords regional analysis (March 2026) via Landlord Today. Compliance percentages: GOV.UK EPC register data. Regional rental income: Valuation Office Agency (VOA). All figures are averages, individual properties will vary.